I am deeply interested in the role that humans will play in the emergence of artificial general intelligence (AGI). Yet, the majority of standard benchmarks — the ways we quantify AGI — fail to adequately measure what is differentially human.
With this in mind, I’ve developed a proof-of concept benchmark for LLM rationality. I chose rationality because it’s essential for the development of wisdom. And wisdom is strongly associated with overall human flourishing. The following sections cover what I think are the foundations of how rationality should be approached in the context of current and future systems.
My instinct was to review the current cog-sci literature and gather what I could find on rationality. This ultimately led to me adapting Toplak and Stanovich’s 2024 work on ART-Y (detailed below). What I found surprised me in many ways and reaffirmed what I knew in others.
And while conducting the experiment was personally illuminating, the results are by no means exhaustive. With more time and resources, this work could be significantly more rigorous. Given what I do have, this is a step in the right direction which hopefully improves the odds (if only marginally) that AGI will lead to humanistic outcomes.
Introduction
It’s “intelligent”, but is it rational?
As of April 2025, it’s no longer a controversial statement that AGI will be smarter than the average human. Many believe the current systems already are smarter. But an equally important question needs answering: is it possible for these systems to be more rational than the average human being? Answering this question requires we distinguish between intelligence and rationality — a difficult task given that it’s hard to pin down expert consensus on what AGI is, let alone artificial rationality.
Often times, our predictions of how AGI will emerge are polluted with somewhat comical assumptions. A common assumption is that AGI will be recognized at once, as if to be ushered in with a tickertape parade throughout Silicon Valley.
Cliched sci-fi tropes aside, assuming AGI will arrive at a discrete moment in time is a common, yet misguided, belief. The flexibility of AGI definitions gives labs more freedom to claim incremental successes, without overpromising to their shareholders. At the same time, a diversity of AGI definitions opens a broader problem space for safety research, which in turn may prevent overfitting to a narrow set of failure modes formulated on one consensus view.
In practice, it’s best to avoid speculating too much on what AGI is or will be. However, if the temptation to speculate is too strong to resist (as is often the case), those speculations should at least be grounded in empirical findings. For example, we can develop a structural view of AGI by extrapolating from the current architectures, scaling laws, etc. Roughly speaking, this approach shows that a single monolithic AGI is highly unlikely (as opposed to, say, a modular system).
More importantly, we can develop a functional view of AGI by studying what the frontier labs measure. To create a functional definition of AGI, we need only review the industry performance benchmarks. By reviewing the dominant benchmarks, we can identify the emerging definitions of AGI, as well as observe any critical gaps in those definitions. Put simply:
Instead of asking what it is, just ask ‘what does it do?’
Industry Standard LLM Benchmarking
As an exercise, let’s examine Evidently AI’s 100+ LLM Benchmarks and Datasets list. Upon reviewing the list, the following categories take shape:
- Cognition (Core Language and Cognitive Capabilities)
- Task Completion (Task-Oriented and Functional Performance)
- Human Wellbeing (Safety, Ethics, and Societal Alignment)
- System Robustness (Robustness, Information Retrieval, and Evaluation Infrastructure)
Although these benchmark categories are subject to change, it appears that AGI can be approximately defined as:
a robust system which demonstrates a range of cognitive capacities and highly performant task completion without compromising overall human wellbeing
While we don’t know Evidently AI’s selection criteria, let’s assume this list of benchmarks is a representative sample of the true population. According to the data, the leading category appears to be Cognition. Yet, within this category, one essential area of interest remains underexplored: rationality. Without a thorough benchmark for rationality, our models remain susceptible to the paradox of foolishness — they can be highly performant and systemically flawed simultaneously.
To address this gap, I’ve adapted Toplak and Stanovich’s Assessment of Rationality Thinking for Youth (ART-Y) into a proof-of-concept LLM benchmark. The preliminary results indicate that LLMs outperform human baselines, challenging our notions of human rationality, and suggesting AGI’s potential to supplement our rational decision-making.
This work not only contributes to the benchmarking landscape but builds upon my previous argument in favor of the Cognitive Anchor. The anchor suggests that our design assumptions for AI should account for our underlying cognitive processes, and not merely cognitive outputs. By applying ART-Y to LLMs, we demonstrate how the Cognitive Anchor can inspire benchmarks for state of the art (SOTA) models which help predict the behaviors of future systems and their integration with human information behaviors.
Towards LLM Rationality Benchmarks
From what I’ve seen, there aren’t any comprehensive rationality benchmarks that can be applied to LLMs. One strong candidate is Macmillan-Scott and Musolesi’s 2024 paper (Ir)rationality and cognitive biases in large language models. And while the authors arrive at interesting observations on the uniqueness of LLM irrationality, their approach is based on an incomplete view.
The authors’ view of rationality aligns with Stein’s Standard Picture. To Stein, rationality boils down to logic and probabilistic reasoning. However, recent research has demonstrated that rationality extends beyond this paradigm to account for broader human reasoning competencies. We look to the work of Toplak and Stanovich (2024) as they promote a more holistic and human-centric definition. Thus, by adapting their standardized rationality assessment (ART-Y), we can explore the implications of AGI systems with greater concern for humanistic outcomes.
Dataset
Adapting ART-Y into an LLM Benchmark
Toplak and Stanovich (2024) introduce the Assessment of Rational Thinking for Youth (ART-Y) as a shortened variation of the Comprehensive Assessment of Rational Thinking (CART). While it’s desirable to use the full CART exam to form an LLM rationality benchmark, existing CART performance data isn’t publicly available. And due to limited resources, I’m currently unable to administer CART to any significant number of human participants at this time. Fortunately, the participant results for the ART-Y paper are accessible via Open Science Framework. The preliminary LLM benchmark findings should therefore be interpreted relative to a human baseline age range of 13 to 18 years old.
ART-Y comprises seven total subtests listed below. For more detail on these subtests, I recommend you read the paper by Stanovich and Toplak.
- Probabilistic and Statistical Reasoning (ProbStat)
- Scientific Thinking (SciThink)
- Avoidance of Framing (AvoidFrame)
- Knowledge Calibration (KnCal)
- Rational Temporal Discounting (RatTemDis)
- Actively Open-Minded Thinking (AOT)*
- Deliberative Thinking (Delib)*
These subtests were administered to 142 participants. Note that most ProbStat and SciThink most closely align with the Standard Picture of Rationality, whereas the remaining subtests go beyond Stein’s model. In their report, Toplak and Stanovich conduct a correlational analysis which demonstrates further evidence of the limited correlation between g factor and core rationality dimensions. Additionally, both AOT and Delib are not components of rationality but rather dispositions which indicate the underlying mechanisms of suboptimal thinking. They are not cognitive capacities, but rather cognitive styles.
Due to limited time, I was only able to run this assessment for five iterations against one model. Therefore, correlational analysis isn’t feasible for the preliminary results due to sample size limitations. Instead, I opted to calculate composite human ART-Y scores and compare them with composite LLM ART-Y values.
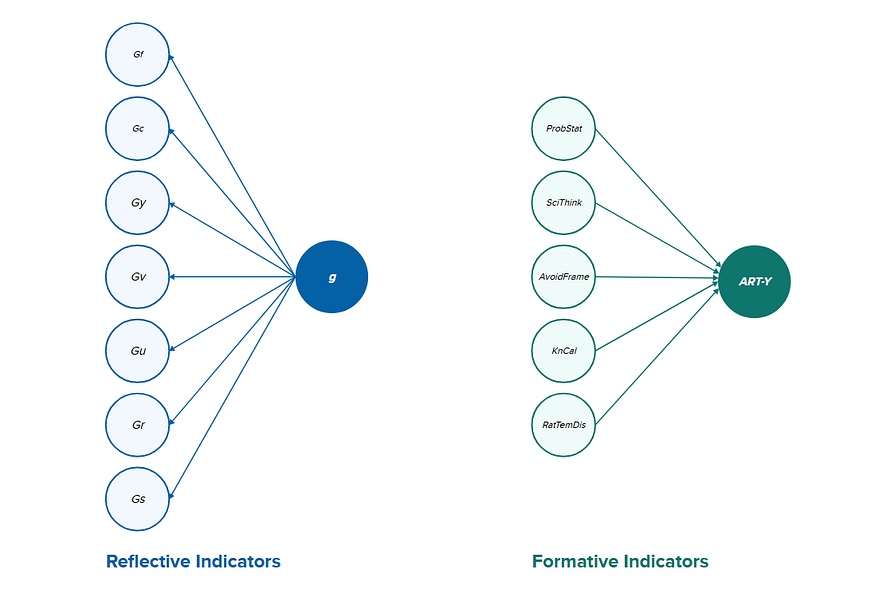
In calculating a composite score for ART-Y performance, we must consider the following caveat. Rationality, as the authors explain it, is a formative construct as opposed to a reflective construct. In other words, the indicators of rationality define the construct of rationality. Changes in these indicators change the underlying construct. Whereas in the case of a reflective construct, changes in the indicators don’t impact the underlying construct.
For example, indicators of intelligence are manifestations of the underlying construct of g. Changes in these indicators reflect g rather than modify it. Therefore, a composite score for rationality is not directly comparable to an intelligence quotient score and should not be treated as such. The disposition subtests AOT and Delib excluded from the composite score, because optimal rational functioning does not arise from changes in cognitive styles.
To calculate the composite values, all human subtests scores were normalized using min-max normalization and then summed to create a maximum score of 5.
Experimental Set Up
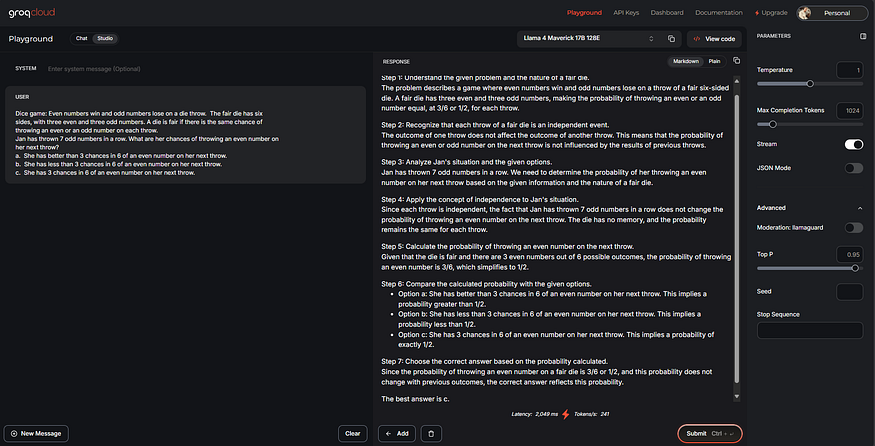
To administer the ART-Y assessment to an LLM, I prompted questions through the Groq Cloud interface to Llama-4-17B-128E, a mixture-of-experts model.
For reproducibility, I followed the general prompting and scoring strategies demonstrated in the Simple Bench paper. Questions were administered to the model a series of five times, providing enough response data to calculate an average composite score (AVG@5) as well as a majority vote score (MAJ@5). The same hyperparameter settings were also applied, configuring top-p at .95 and temperature at .70.
Below is a screenshot of a typical question and response using Llama 4 Maverick in the Groq Cloud playground interface.
Results
Exploratory Data Analysis
Following the five iterations, I conducted a high-level analysis of the preliminary data. The composite scores demonstrate that Llama 4 Maverick outperforms the human baseline across the board.
While correlational analysis is out of scope for this article, it’s worth investigating performance by subtest. Upon closer examination, Llama 4 Maverick outperforms the human baseline on all subtests. The strongest performance was observed on the ProbStat and SciThink subtests, which yielded perfect scores. The KnCal subtest followed closely behind with a near perfect score. However, Maverick didn’t ace the entire assessment. In a longer piece, I’d like to cover the implications of each nominal subtest score. Instead, I’ll interpret these findings relative to the average performance delta.
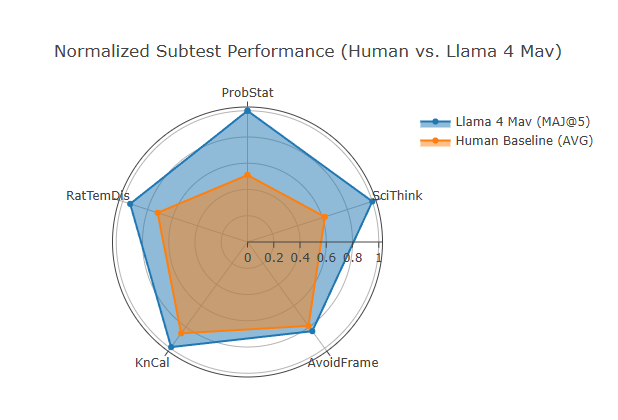
The above radar chart visualizes the normalized subtest performance of the human baseline as compared with Llama 4 Maverick (MAJ@5). On first glance, we notice the model outperforms the human baseline on all subtests. The ProbStat and SciThink subtests exhibit the greatest performance delta, whereas the KnCal and AvoidFrame subtests appear to exhibit the smallest performance delta.
The bar chart above includes subtest scores for Llama 4 Maverick (MAJ@5 and AVG@5) as compared with the human baseline. MAJ@5 scores tend to mirror AVG@5 scores; with the exception of RatTemDis and ProbStat. The human baseline scores lowest in each subtest. This is a strong snapshot of nominal scores, but let’s take a closer look at the ratios of LLM-to-human performance.
The following bar chart illustrates these performance deltas per subtest. Values have been included above each bar in red to indicate the difference between human performance and the max score for the LLM. These values were calculated by subtracting the human score from the greater of either MAJ@5 or AVG@5 to assume the most liberal estimate of performance delta.
From these results, we see that Llama 4 Maverick doubles the human baseline score for the ProbStat subtest at Δ = 0.50. SciThink follows as the second largest delta, where Δ = 0.38. The remaining three subtests fall beneath the average of Δ = 0.26, suggesting greater parity with human performance. The two subtests with the smallest deltas are thus confirmed to be KnCal and AvoidFrame at Δ = 0.13 and Δ = 0.05 respectively. Using the average, we can create two sets for closer analysis: above and below average deltas.
Discussion
Above-Average Subtest Deltas
ProbStat. According to our data, ProbStat and SciThink both rank above the average delta. Regarding the ProbStat subtest, Toplak and Stanovich (2024) write:
“probability assessment is central to…epistemic and instrumental rationality…determining the best action involves estimating the probabilities of various outcomes. These probabilities are not typically conscious calculations of course — they are beliefs about states of the world and the confidence that a person has in them.”
So why does Maverick outperform the human baseline for ProbStat by Δ = 0.50? One possible answer to this question lies in the final sentence of the above quote. For humans, probability calculations “are not typically conscious” but are instead based on “beliefs about states of the world” and our relative confidence in those states. Humans usually arrive at an answer for ProbStat questions through implicit operations.
Whereas Maverick appears to arrive at an answer by working through the question “step by step.” The LLM performs each calculation through explicit operations. It makes its beliefs about states of the world and its confidence in those states “conscious.” Maverick leverages its mixture-of-experts architecture to perform these calculations with maximum computational efficiency. Thus, the explicit and mixture-of-expert tactics used by Maverick outperform the implicit and belief-driven tactics used by humans. But does the same dynamic apply for the SciThink subtest?
SciThink. According to Stanovich and Toplak, the SciThink subtest assesses “evaluation of evidence, hypothesis formation, and theory testing.” Each of these key areas are critical to scientific reasoning, as people tend to seek to confirm theories rather than falsify them. Furthermore, these areas form the foundational skills that “makes scientists more confident that their conclusions rest on a solid empirical foundation.” The authors provide additional insight into human SciThink task performance. On the topic of the Wason four-card selection task, the authors write:
“Although there are many alternative theories that explain task performance… one of the oldest theories is that people focus on confirming the rule. Although people might perform poorly for many different reasons…there is no question that a concern for falsifiability would rectify the error.”
Llama 4 Maverick outperforms the SciThink human baseline by Δ = 0.38. As with ProbStat, it’s possible that this performance arises from the difference between Maverick’s and the average human’s default rationalistic stance. For example, Maverick may possess sub-networks which functionally amount to greater “concern for falsifiability” than the average human. Or at the very least, does not exhibit the same bias toward “confirming the rule” as humans, which liberates its computational resources to more effectively answer such questions. Note, SciThink includes questions beyond falsification as well. Therefore, the above reasoning represents a simplified account of only one aspect of the subtest. Given more time, I’d explore the remaining facets in greater detail.
What we begin to see in our ProbStat and SciThink deltas is that Maverick’s performance may arise from its tendency to systematically approach problems without human cognitive biases. Unlike the ART-Y human participants, who rely on heuristics and beliefs, Maverick’s architecture allows it to explicitly work through each logical step. This begins to suggest that LLMs of similar design to Maverick can excel in tasks requiring what research identifies as epistemic rationality.
Below-Average Subtest Deltas
Each of the following subtests fell below the average delta of Δ = 0.26.
- RatTemDis (Δ = 0.23)
- KnCal (Δ = 0.13)
- AvoidFrame (Δ = 0.05)
RatTemDis. The Rational Temporal Discounting subtest asks participants to choose between receiving a smaller amount of money now or a larger amount of money later (e.g., $5 today or $10 tomorrow). This measures what Toplak and Stanovich (2024) refer to as the shift in focus from the “here and now” to the consideration of future outcomes. Delayed gratification is seen as “central to conceptions of rationality and wisdom,” and is at the core of goal fulfillment and addiction. I highly encourage you to read their paper to learn more.
Perhaps it’s best to review the human baseline score. The youth participants scored, on average, 72% for RatTemDis. One could imagine that an imperfect score for a subtest measuring delayed gratification accurately represents the age range of the sample population: 13–18 years old. It’s possible that an older age group would score even higher on this subtest, since age may positively correlate with delayed gratification.
Maverick AVG@5 scores reach 95%, and MAJ@5 scores yield a value of 94%. From these results, we can conclude that the functional delayed gratification of Llama 4 Maverick exceeds that of the youth human sample population. These results are hardly surprising, as one would hope that AGI is more “mature” than the average teenager in this sense.
KnCal. Toplak and Stanovich (2024) introduce Knowledge Calibration as a subtest for assessing how well one calibrates their degree of certainty about things they think they know. Consequently, KnCal is thought to be strongly related to epistemic rationality. For these questions, participants answer true/false questions and provide confidence scores estimating the “subjective probability that their answer is correct.”
Maverick achieved a near perfect score on the KnCal subtest. Yet given that the performance delta is less than the average, we can assert that human youth and Llama 4 Maverick demonstrate a comparable degree of knowledge calibration. Or at least more comparable than that of ProbStat and SciThink based reasoning.
However, this specific subtest is largely comprised of questions testing factual knowledge. And being that LLMs are trained on vast amounts of internet data, it isn’t surprising that they would achieve a perfect score. In fact, it’s even more interesting to see the degree of similarity between the human baseline and LLMs given the humans’ lack of internet access.
Perhaps the most revealing subtest is AvoidFrame. This subtest yields a value of Δ < 0.10 and is the most comparable to the human baseline.
AvoidFrame. Rational humans are expected to hold “stable underlying preferences for each of the options presented in a decision situation.” However, the research indicates that changing how the options are presented to an individual can alter the choices they make (Toplak and Stanovich, 2024). It’s therefore believed that rationality adheres to descriptive invariance, and that “the preference order between prospects should not depend on the manner in which they are described.” The AvoidFrame subtest measures the participant’s adherence to the principle of descriptive invariance.
With a delta of Δ = 0.05, Maverick scores only slightly better than the human baseline on AvoidFrame questions. Both the human participants and Maverick score ~80%, suggesting significant room for improvement. Importantly avoidance of framing is correlated with the individual’s ability to leverage consistent internal preferences to act optimally and achieve one’s goals. Yet, given the data, Maverick’s preference consistency appears to score near the range of a 13–18 year old human.
Limitations and Future Work
This project has several limitations which should be addressed. The extent of this effort is limited to a proof-of-concept and the findings are not exhaustive.
Future iterations of LLM rationality benchmarks leveraging ART-Y should incorporate a broader range of models, controlling for architectures and parameter counts. For more robust statistical analysis, a larger sample size of model responses (e.g., >1000) should be captured. This will enable correlational analysis between subtest performance and can leverage automated prompting techniques where applicable.
Given that the model achieves perfect or near perfect scores on most ART-Y subtests, it would be beneficial to administer the full CART assessment. This would also expand the interpretations beyond a human baseline with an age range of 13–18 years old.
Another area for future work is in the use of continuous context sessions. For this experiment, questions were administered to Llama 4 Maverick in discrete context sessions, and thus no context length analysis could be conducted.
Finally, it was apparent throughout the experiment that many of the subtest questions could be derived from relatively simple google queries. This suggests that many of the questions were not google-proof. It’s therefore critical to rule out inclusion of subtest questions, such as the four card selection task, in the model’s training data.
Conclusion
I began this project with the intent of developing a proof-of-concept rationality benchmark for LLMs. The approach taken adapts the ART-Y assessment because it provides a contrasting, and more humanistic, view to Stein’s Standard Picture of Rationality which prioritizes logic and probabilistic reasoning.
The data showed that Llama 4 Maverick outperforms the human youth baseline on all subtests. However, by looking beyond the nominal scores, we see the delta between Maverick’s and the human baseline is smallest on those subtests least associated with Stein’s model of rationality. Importantly, Maverick’s imperfect scores on subtests such as AvoidFrame have meaningful implications for AI safety and the realization of the elusive AGI.
Given the results, we cannot say that Llama 4 Maverick is perfectly rational insofar as ART-Y can assess. It’s incumbent upon future benchmarking and safety efforts to incorporate rationality as a crucial component in our definition of AGI. As new paradigms such as general world models (GWMs) and agentic frameworks proliferate, greater portions of our rational information behavior will be offloaded to autonomous systems.
With any luck, if future LLM benchmarks take rationality as a serious consideration for humanistic outcomes, AGI will be defined as:
a robust system which demonstrates a range of rational* cognitive capacities and highly performant task completion without compromising overall human wellbeing
It’s at this point that the central question changes from “are LLMs rational” to “how can we harness their beyond-human rational capacity?” What does a future with sages in every household, where wisdom is freely available, look like?
And these are the exciting questions to ask.
References
Toplak, M and Stanovich, K. (2024) Measuring Rational Thinking in Adolescents: The Assessment of Rational Thinking for Youth (ART-Y)
Evidently AI. LLM Evaluation Benchmarks and Data Sets. https://www.evidentlyai.com/llm-evaluation-benchmarks-datasets
Source: www.medium.com